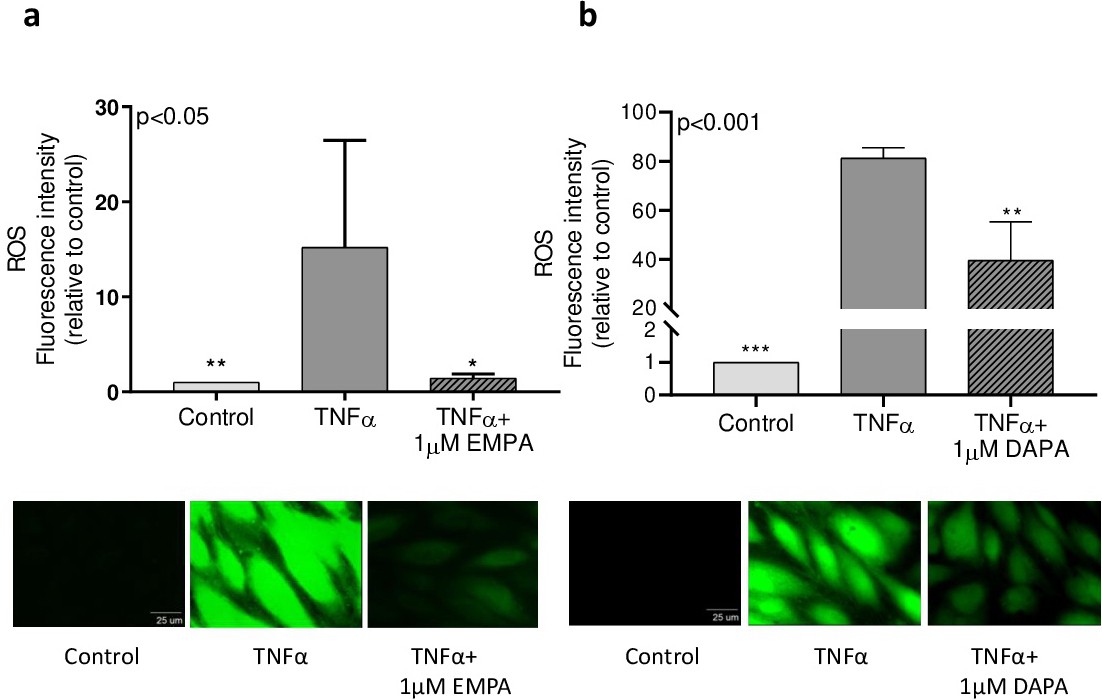
Fig. 2. ROS levels of endothelial cells treated with TNFα , TNFα and EMPA or DAPA. HCAECs were treated with 0.02% DMSO (control), 10 ng/mL TNFα or with 10 ng/mL TNFα with 1µM EMPA or DAPA for 6h. ROS levels were measured using live cell imaging in HCAECs (a, n=5, b=n=3) Representative images are shown in the lower panels. Data are presented as mean±SD. *p<0.05 vs. TNFα, **p<0.01 vs TNFα.